Graphic Facilitation: A way to reinforce learning, increase engagement and co-create understanding
When it comes to learning about or exploring a complex idea, what helps it stick in your brain? A long, detailed written report…or a colorful graphic that highlights the main points of the topic?
If you said the latter, you’re in good company – the majority of people are better able to comprehend and retain complex information when there are graphics to support it.
Using graphics to support ideas is nothing new, but leveraging this principle when you’re doing group work can make a huge impact on how people interact and connect – both with the concepts and each other. That’s why many companies and organizations use graphic facilitation to make meetings and group sessions more effective.
What is Graphic Facilitation?
Graphic facilitation is a way to help people solidify their learnings and deepen their thinking by using the power of visuals in real time, at an event or meeting.
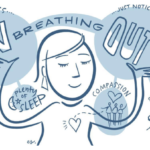
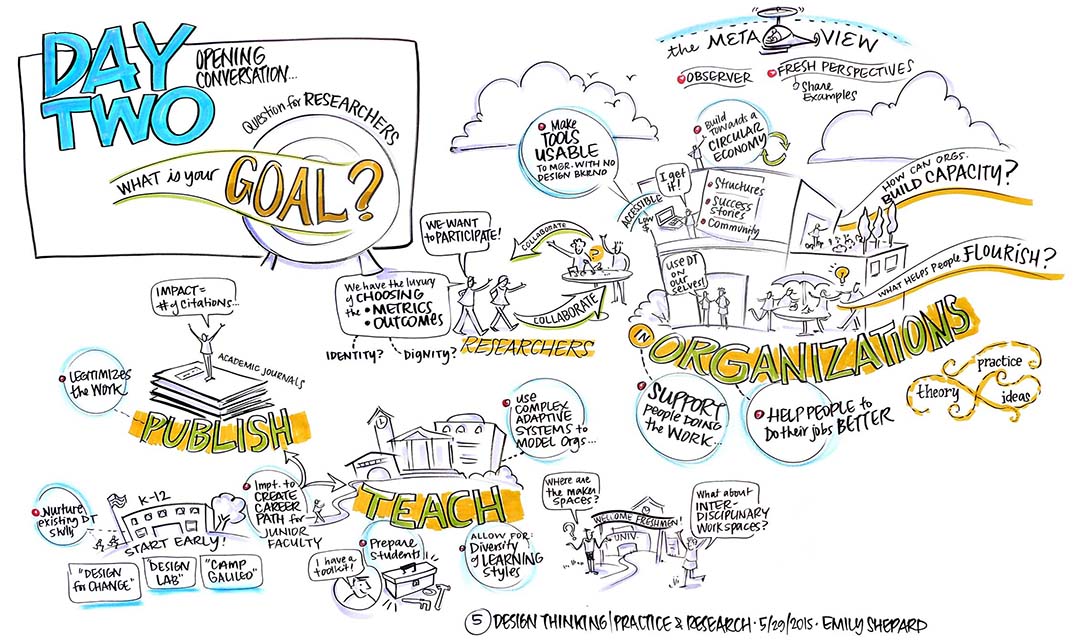
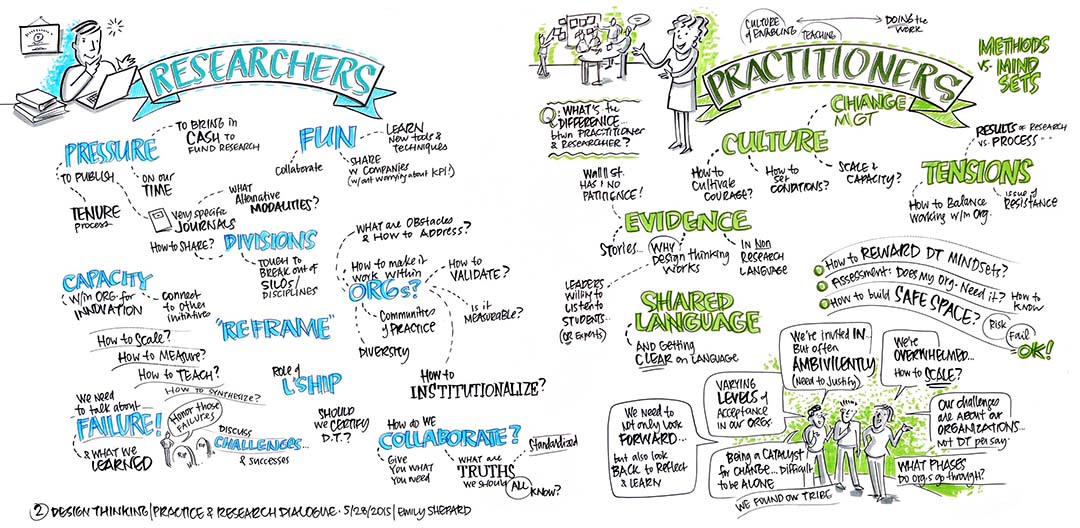
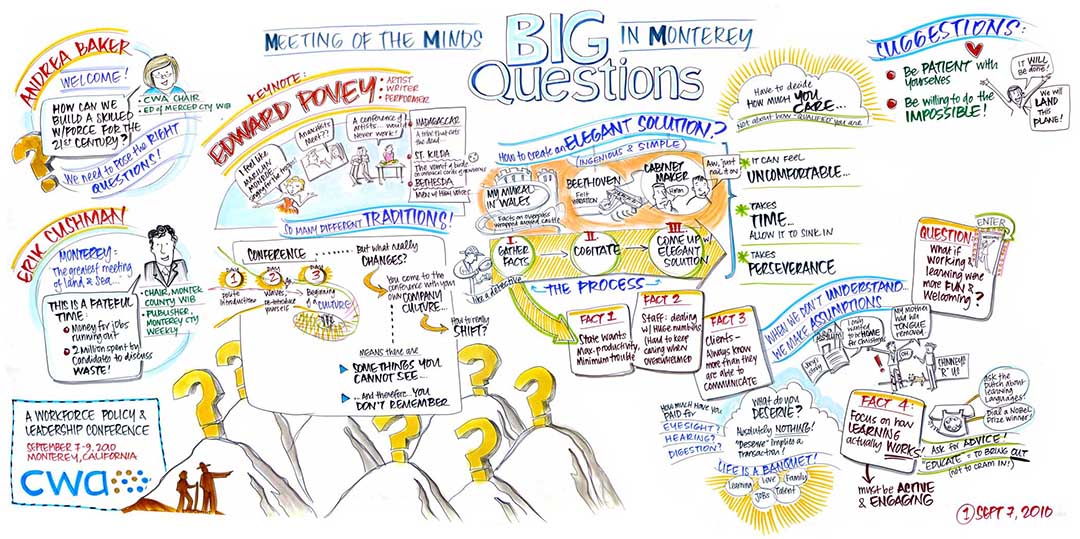
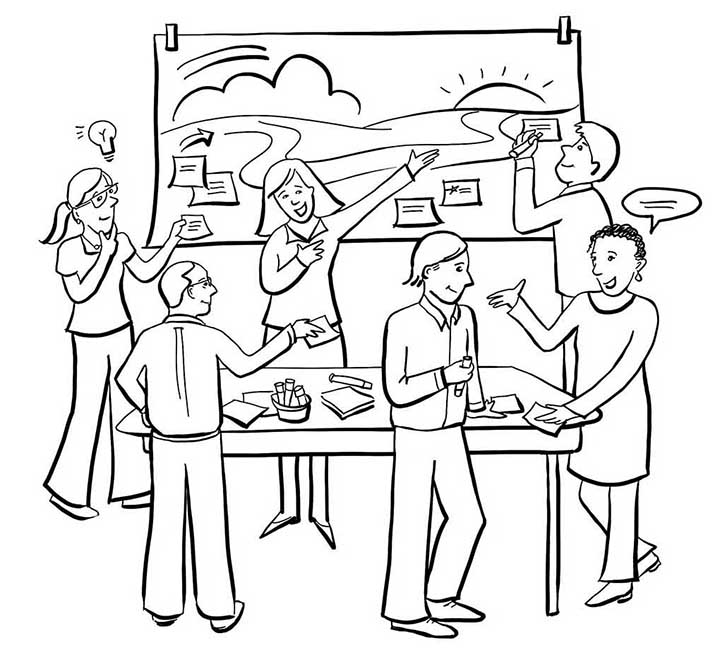
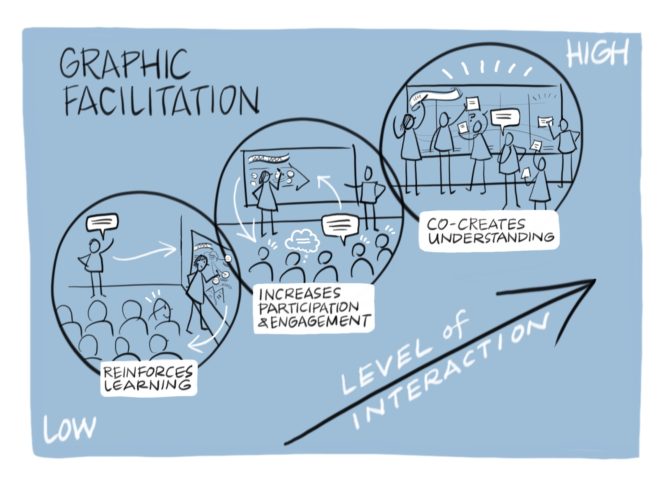
Depending on the context in which it’s used, the benefits of graphic facilitation can range from from reinforcing learning, to increasing participation and engagement, to co-creating understanding. Above is a visual that illustrates this idea. Let’s unpack this graphic, one bubble at a time.
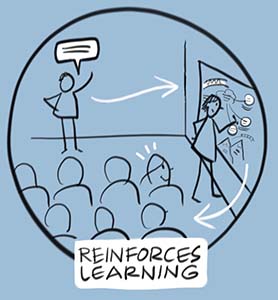
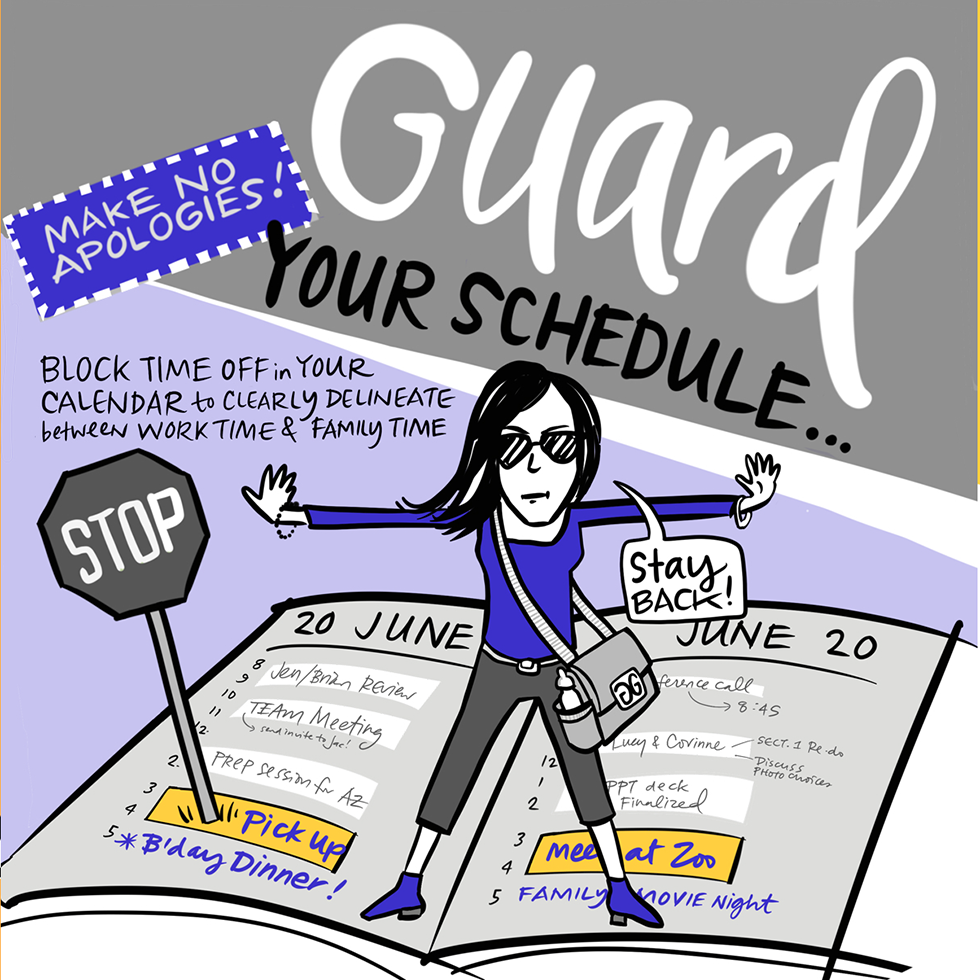
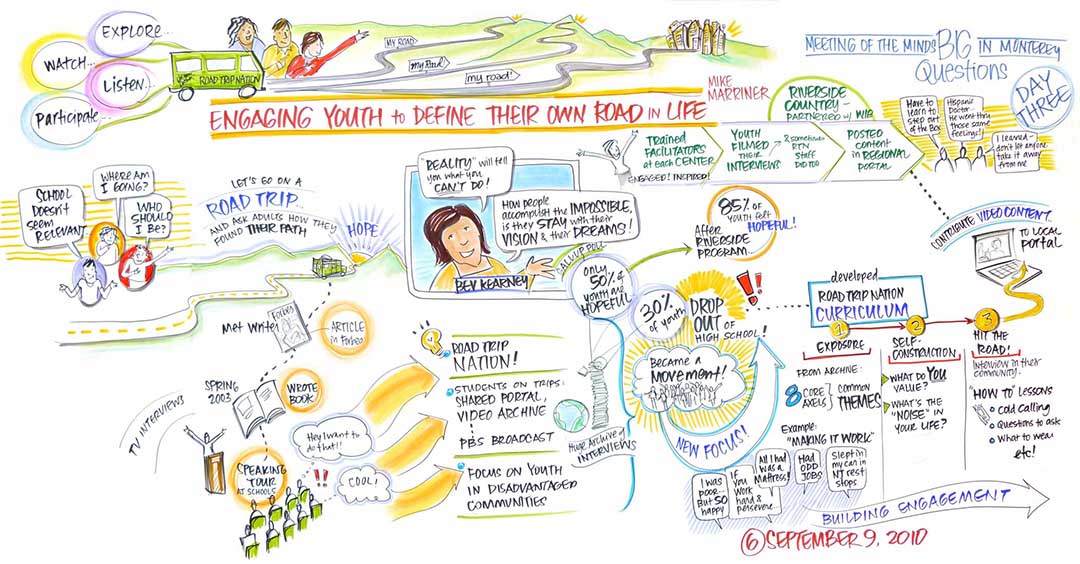
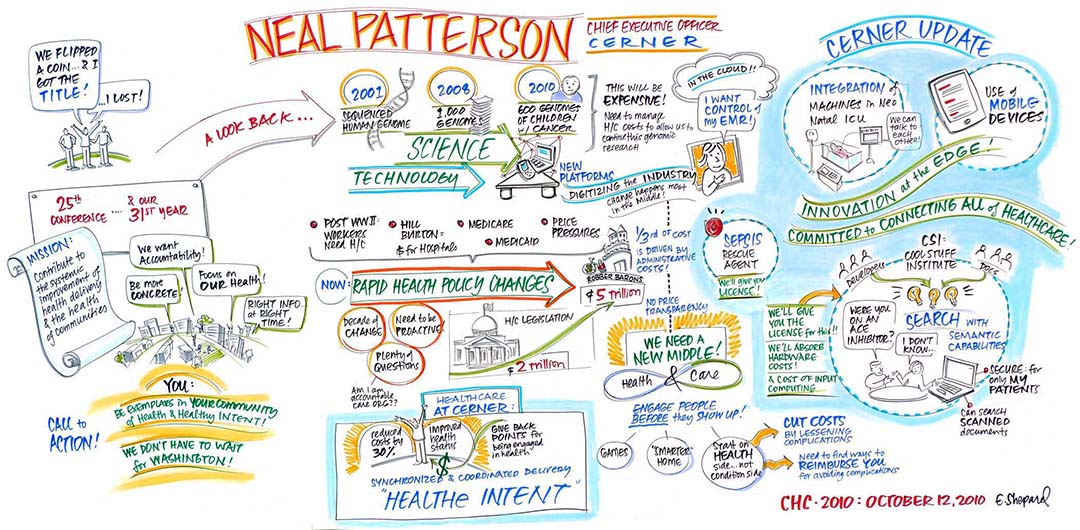
Graphic Facilitation Reinforces Learning
Useful for:
- Keynote Speeches
- Conferences
- All Hands Meetings
- New Product Rollouts (and more)
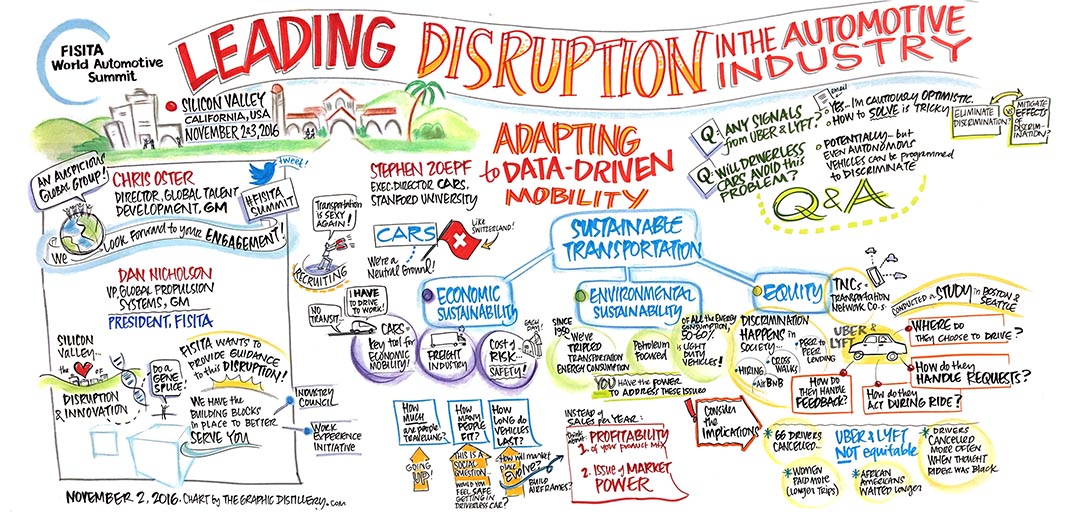
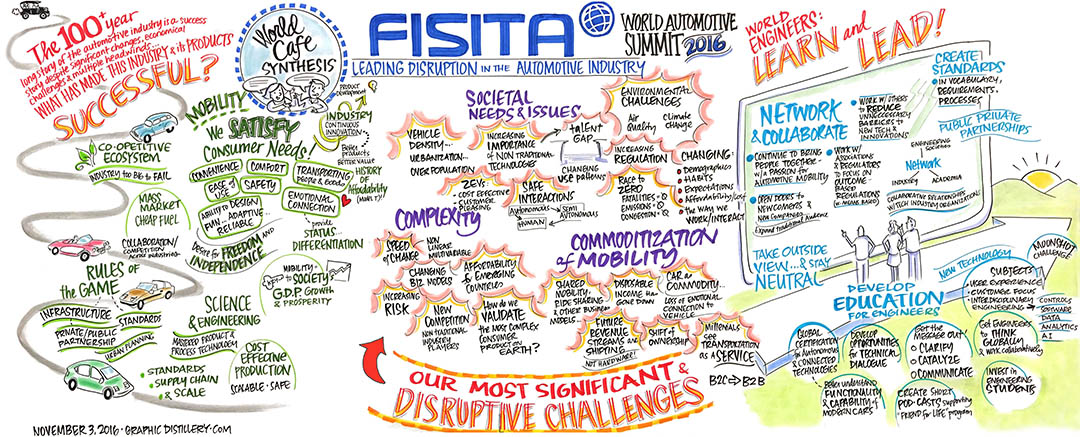
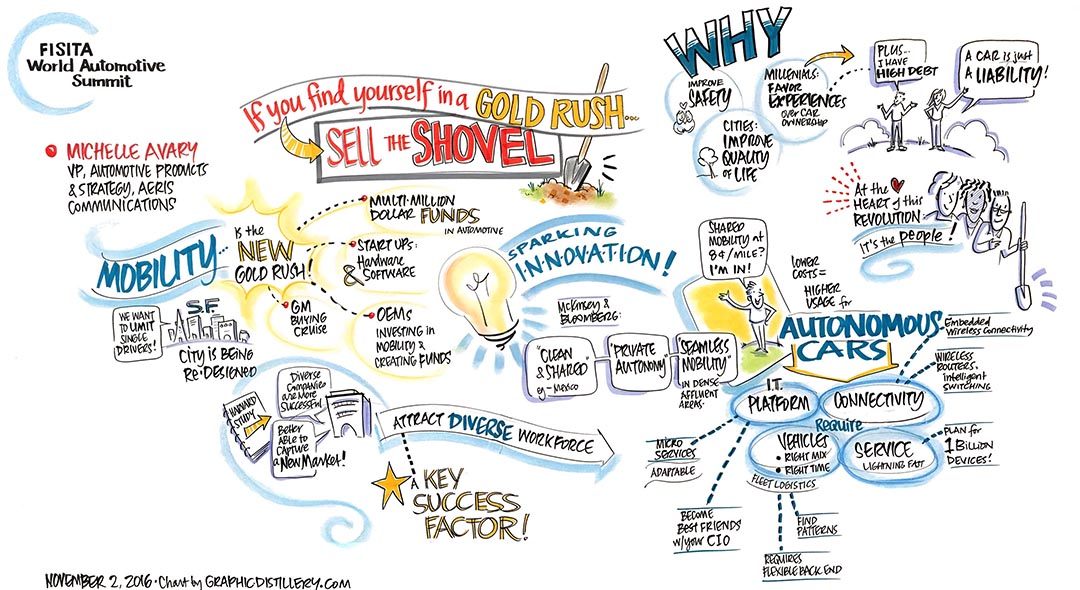
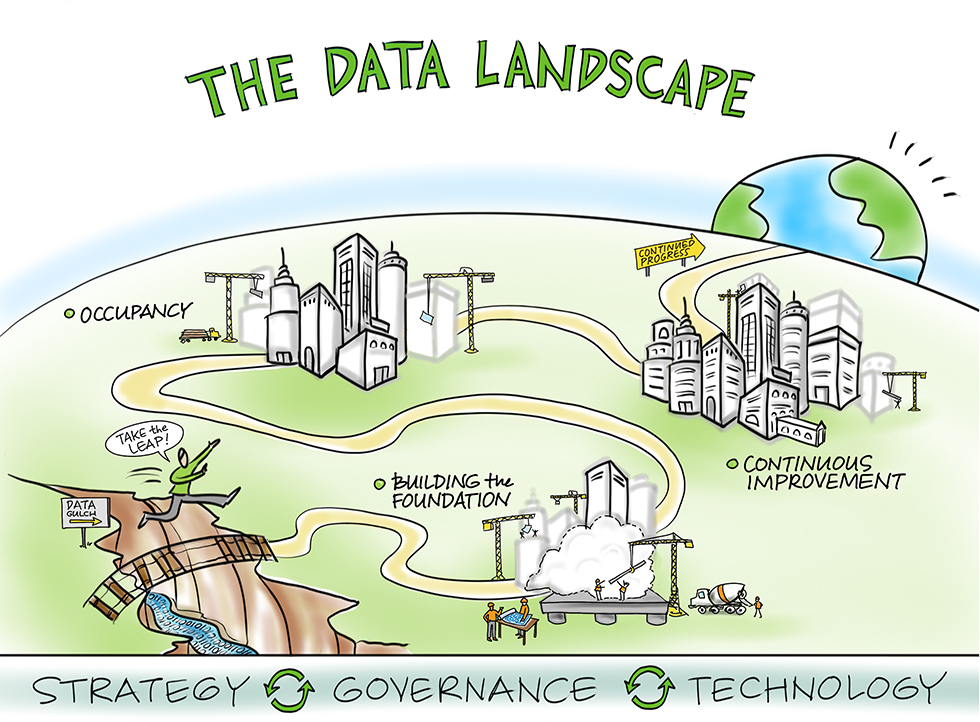
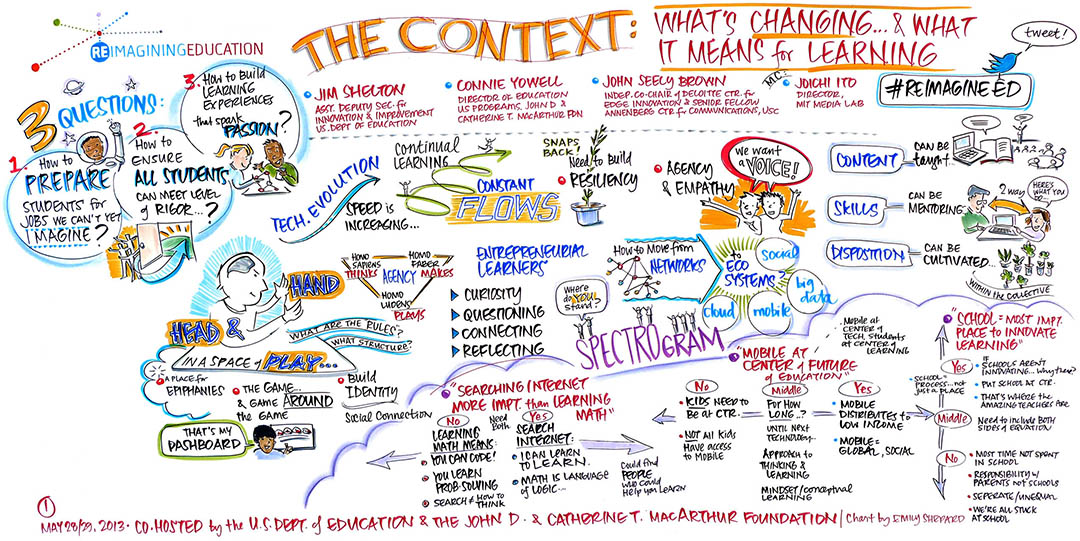
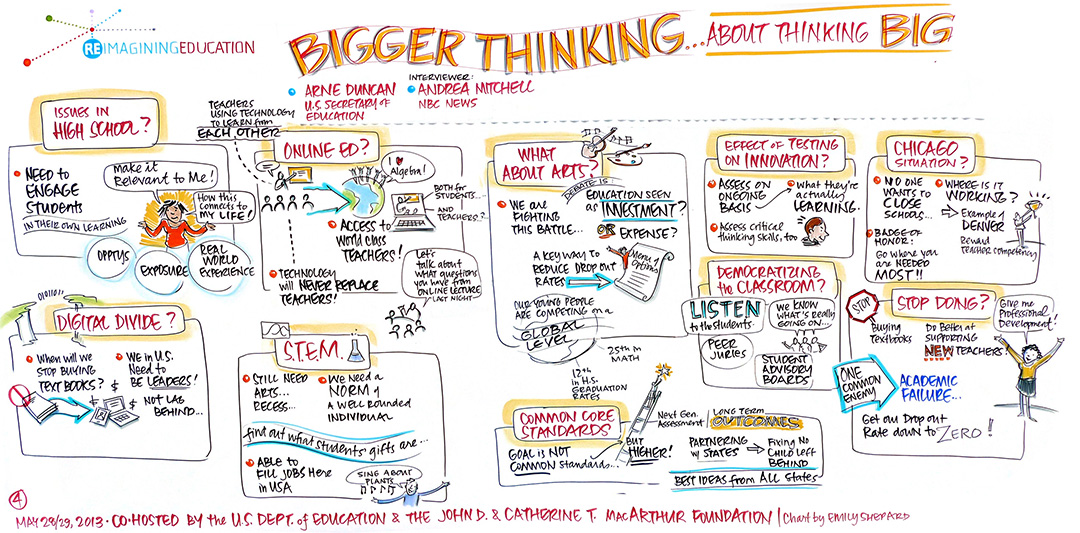
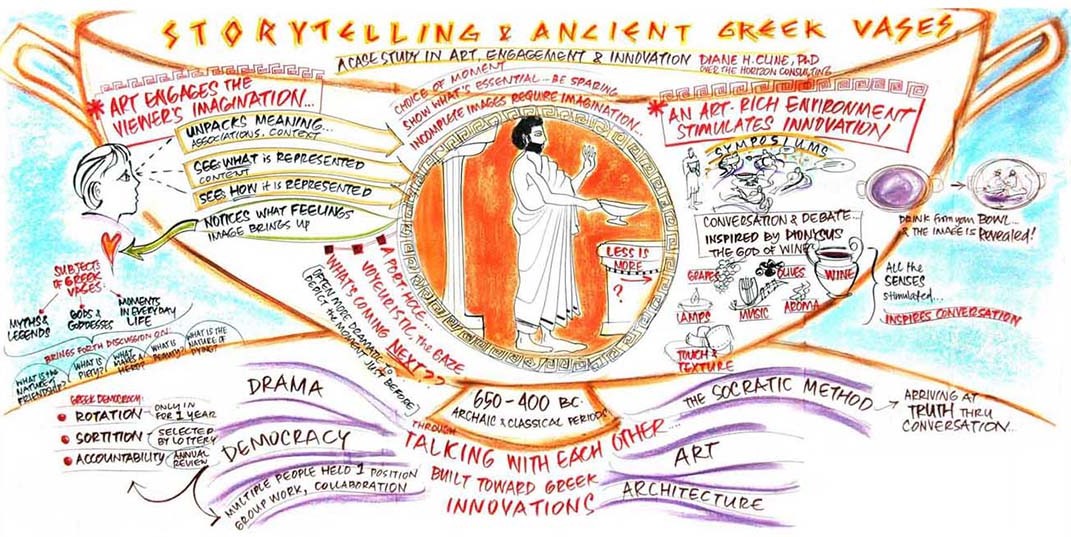
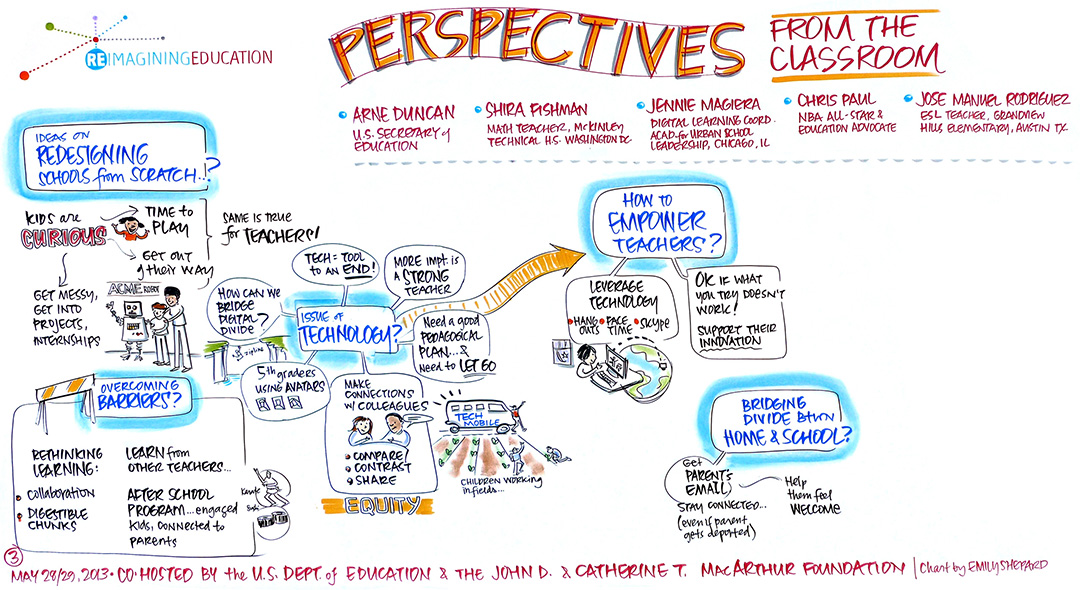
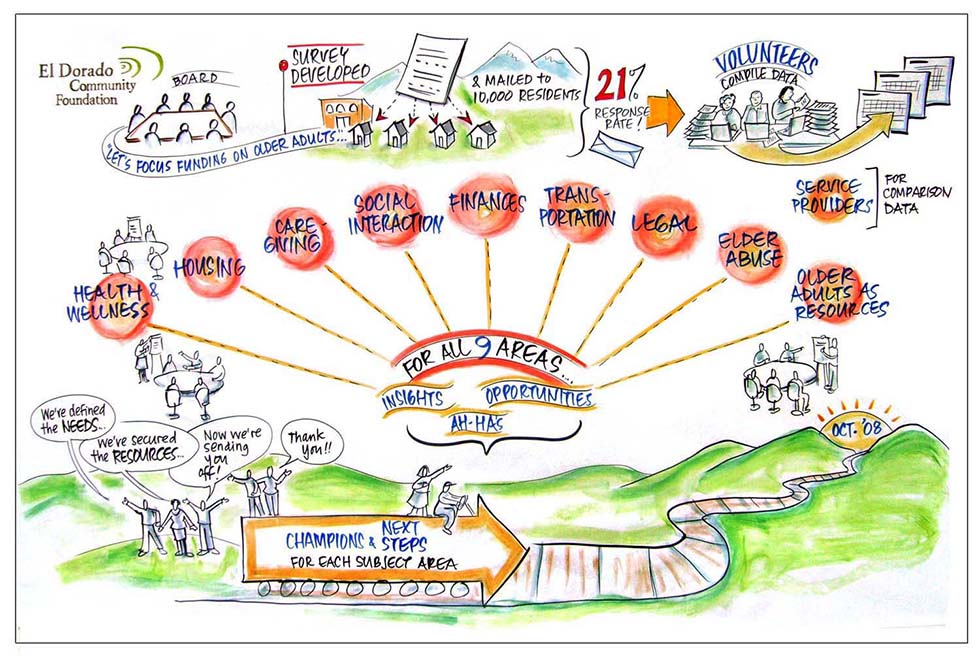
Let’s use as our first example, a keynote speech. As the speaker shares his or her thoughts, the graphic facilitator listens for the main points, synthesizes the content, draws connections and pulls out the themes. The graphic facilitator does this using words and images, creating a visually organized “map” of the key content presented by the speaker.
In this case, the interactivity happens through the eyes – the participants can watch the chart being created in real time, and see the speaker’s main points get captured onto the visual map, translated into words and images.
Afterwards, when the audience members see the visual map displayed – either in person or online – the content and energy of the speaker comes flooding back to them. As they reflect on the visual chart, either by themselves or in conversation with others, the visual images and connections serve to boost their comprehension and retention of the content.
According to the picture superiority effect, people only remember about 10% of what they read in words, but they remember up to 65% of what’s presented when the content is is in words with a related image or visual. A keynote, distilled by a graphic facilitator into text and images can allow people to remember more of the flow and main content of the speaker’s message.
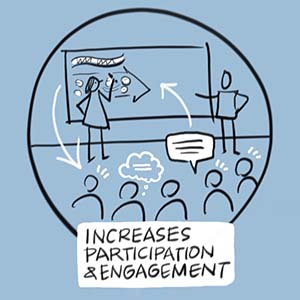
Graphic Facilitation Increases Participation and Engagement
Useful for:
- Strategy Sessions
- Board Retreats
- Ideation Sessions
- Determining Mission/Vision/Values (and more)
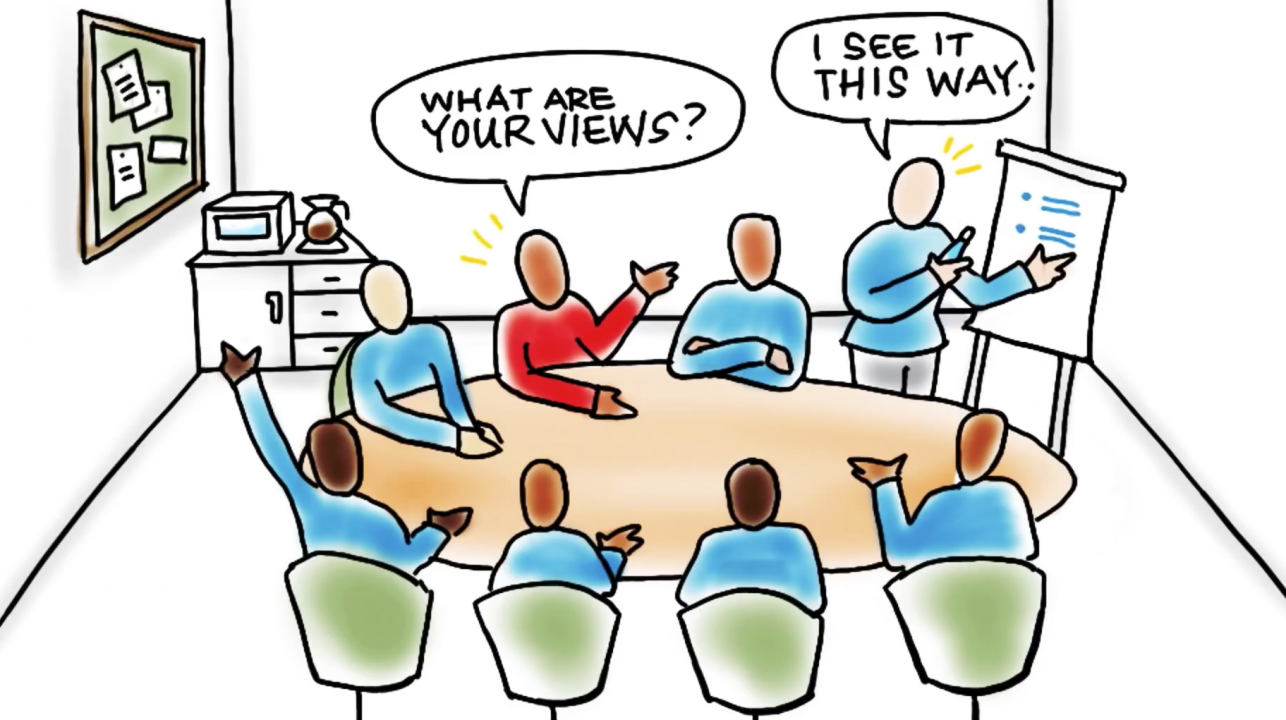
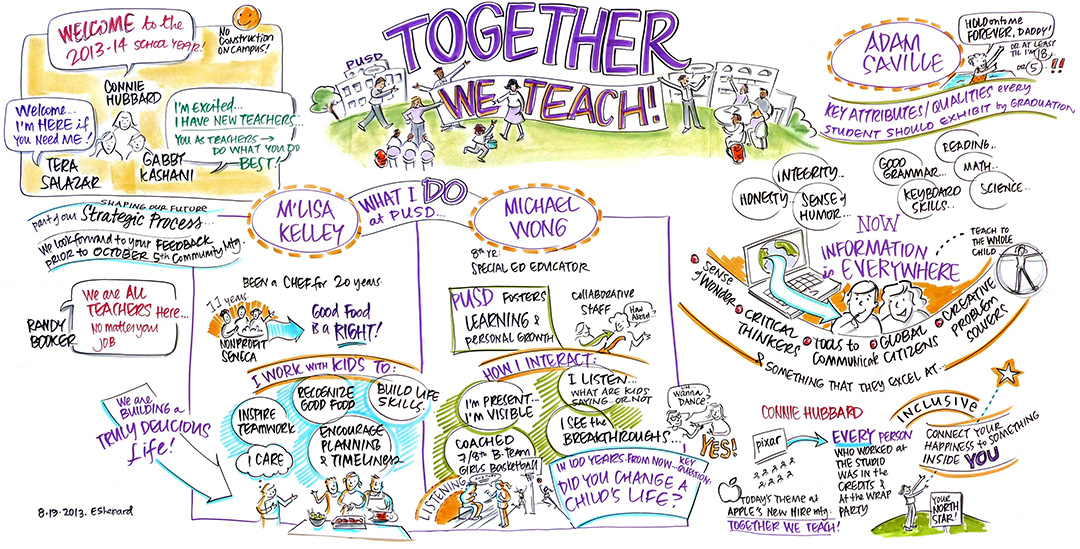
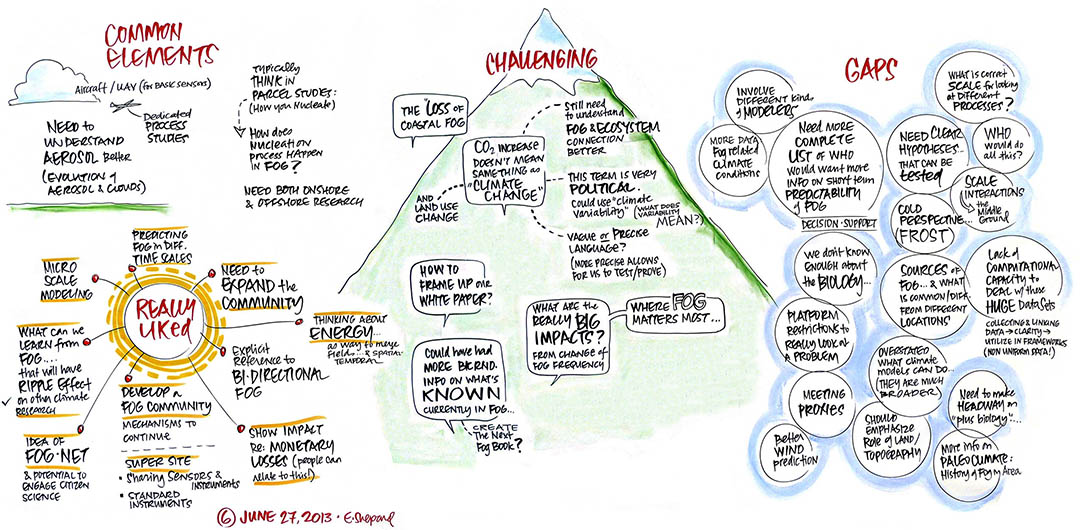
Having a face to face meeting is a big investment. By adding graphic facilitation, you can get the most value out of the group’s time together. Here, we’ll use the strategy session as our example.
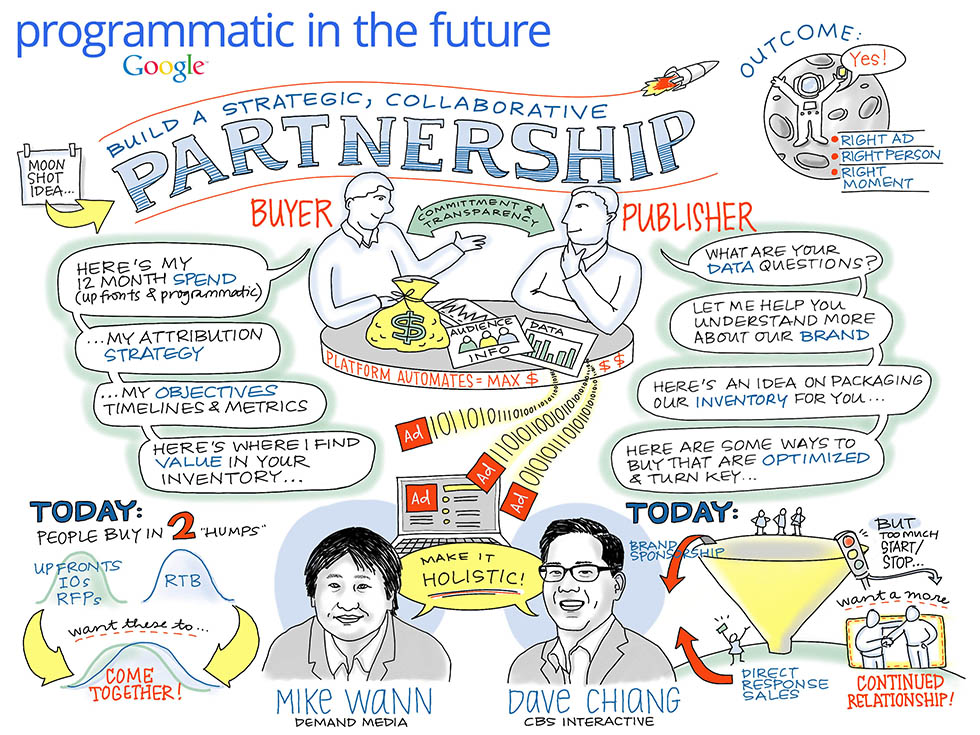
As the graphic facilitator captures the essence of people’s comments onto the large format chart, the participants can immediately see that they’re being heard, and can refer to the chart to keep track of the developing conversation. With the key points always in view, the participants are freed up to fully focus on the strategic content of the discussion.
Participants can continually reflect on the content as more charts are created over the course of the day. Not only does this build engagement and momentum, as they see tangible evidence of their progress, but it also engages them as they use the charts as thinking tools, and look for connections, gaps, opportunities and insights, and later, build out their action plans.
There’s a certain magic that happens when thoughts get externalized and are physically tangible up on the big paper. The ideas or thoughts become independent of the person who spoke them, and instead, now exist on the paper in the company of other ideas. Seeing their thoughts externalized allows people to gain perspective and notice new possibilities.
Most often, the graphic facilitator partners with a process facilitator, who may be an internal or external consultant, working with the group or team. Because the graphic facilitator is fully committed to the visual capture, the process facilitator is freed up from that work, and is able to be 100% present with what’s happening in the room. He or she can fully attend to the non-verbal signals, manage the energy, and keep the group on track to meeting their outcomes.
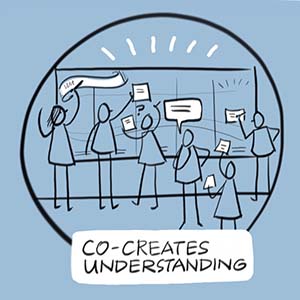
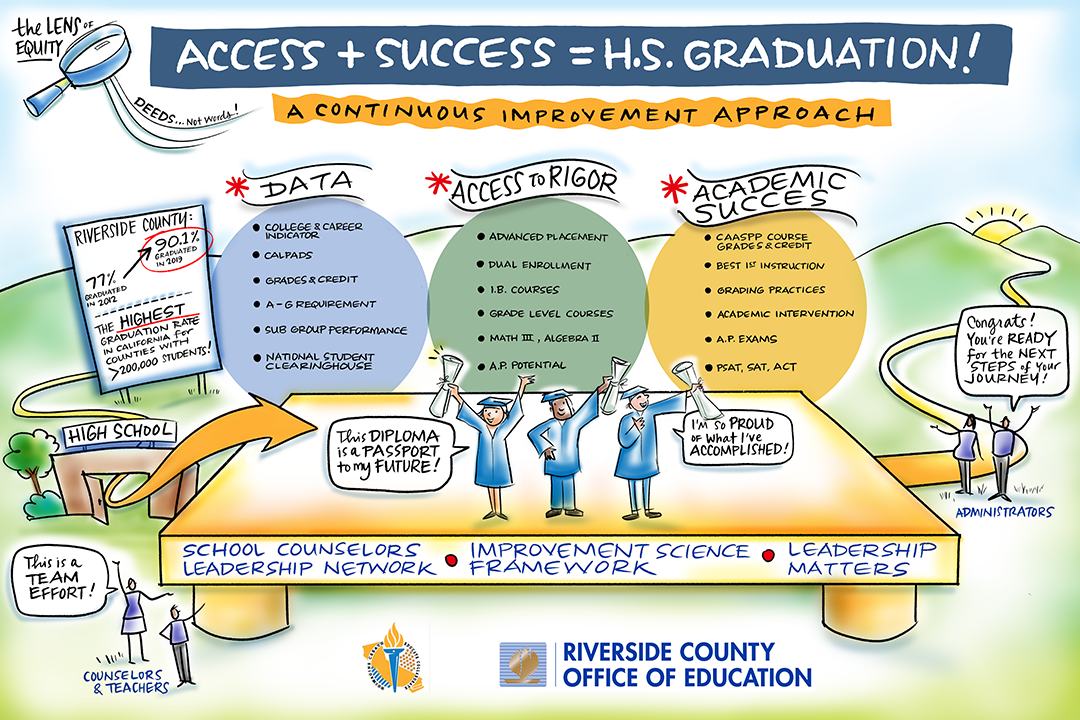
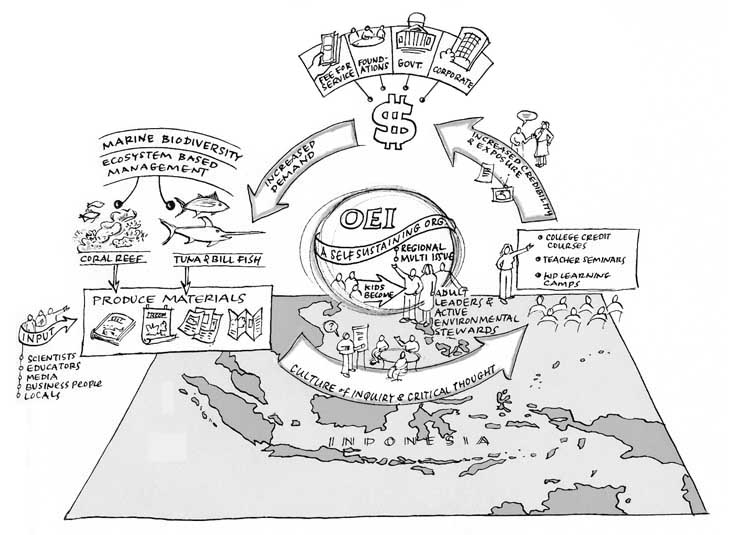
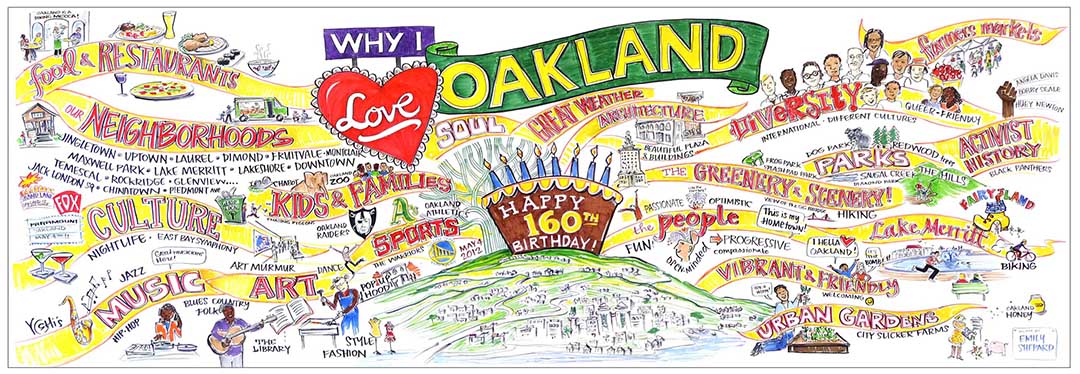
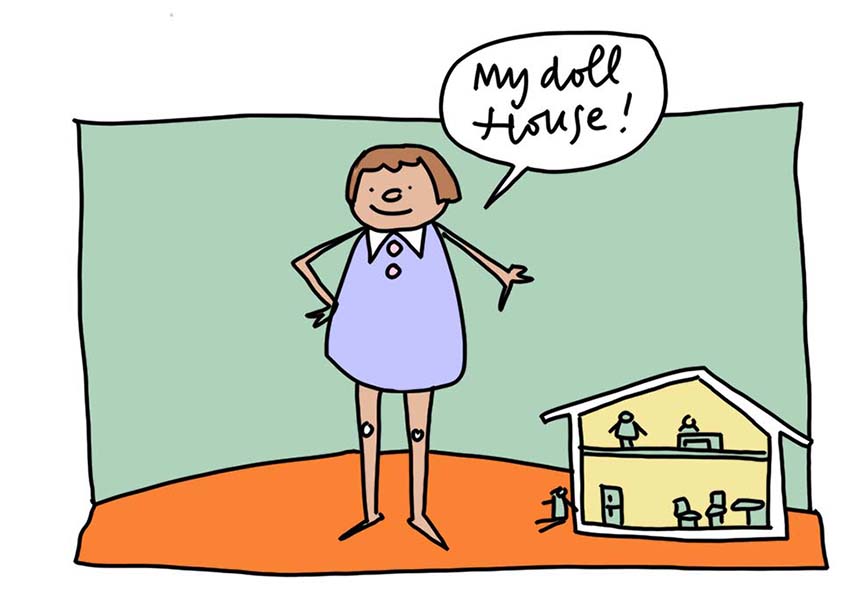
Graphic Facilitation Co-Creates Understanding
Useful for:
- Creating an Organizational History Map
- Human Centered Design Prototyping
- Mapping or Storyboarding a Process Flow
- Small group Breakout Templates (and more)
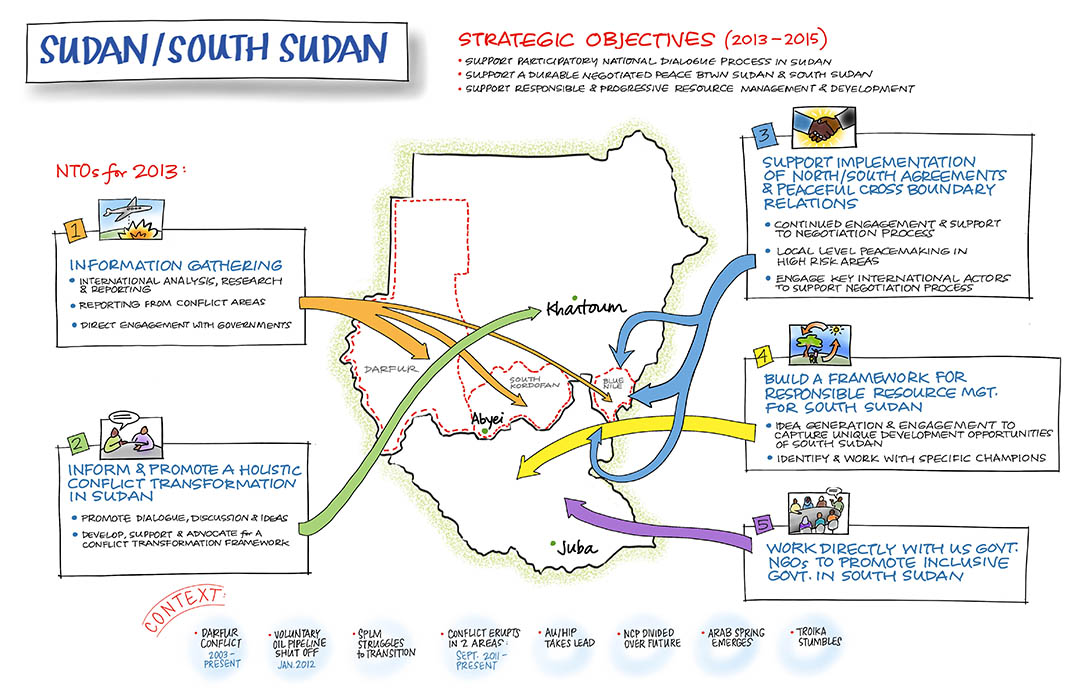
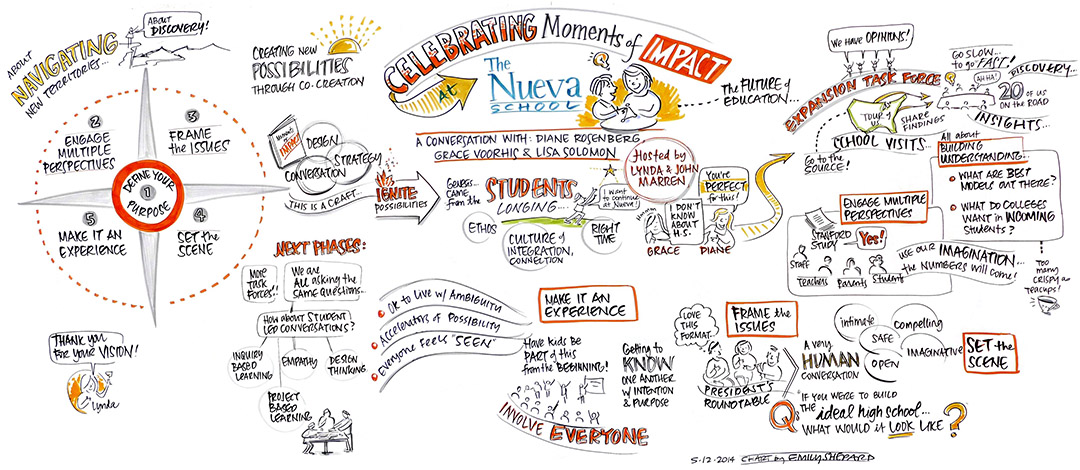
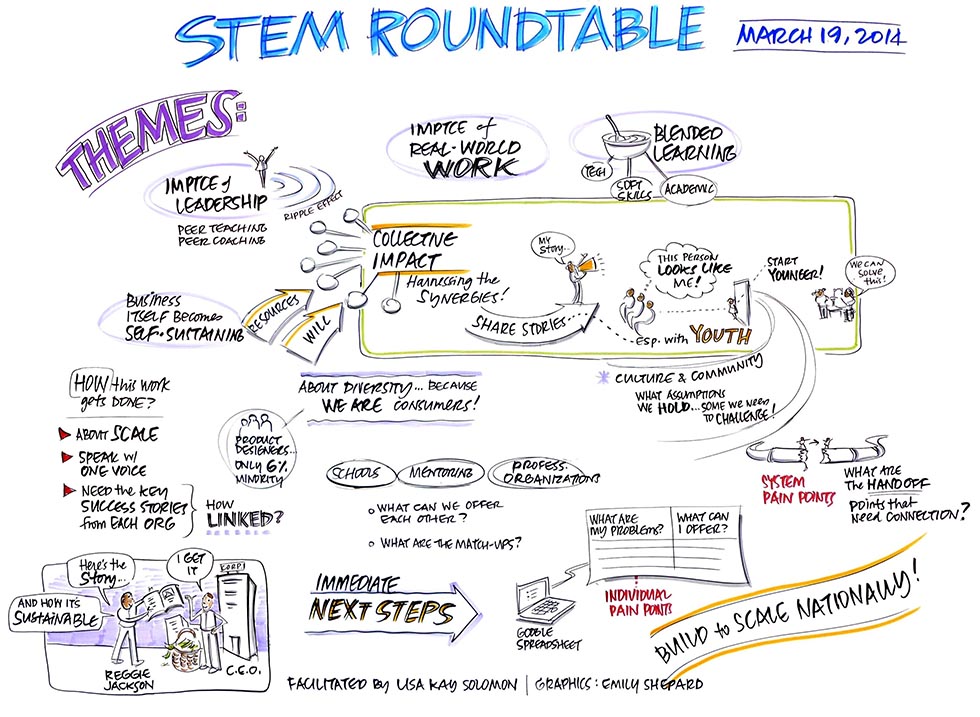
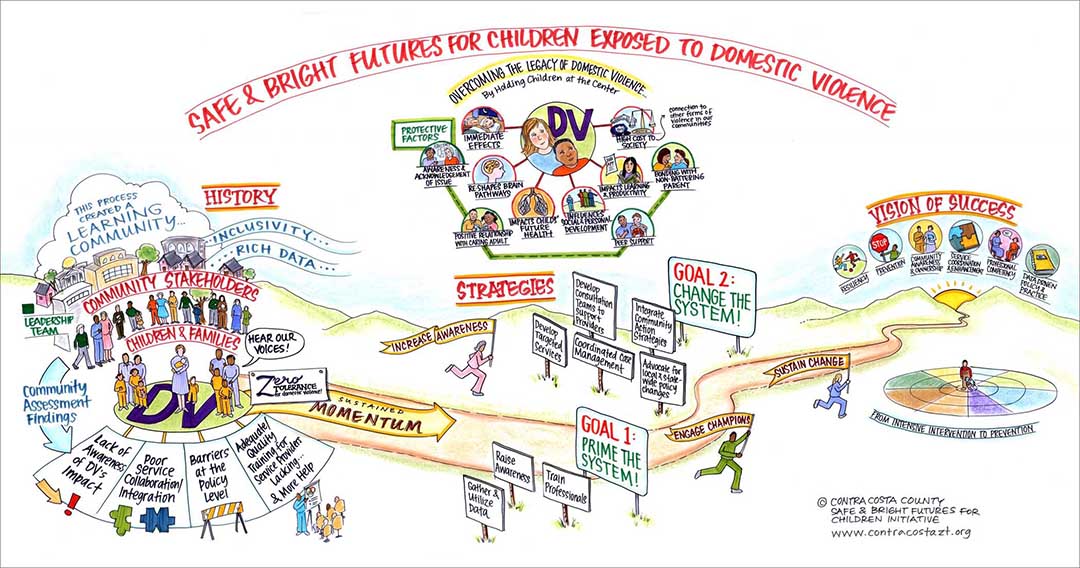
At this level of interactivity, the charts are fully integrated with the group’s process, and are a vehicle to co-create understanding. When these kinds of processes are happening, the energy is high! People are on their feet, sleeves are rolled up, as they work together, discussing and debating, using visuals to co-create a shared understanding.
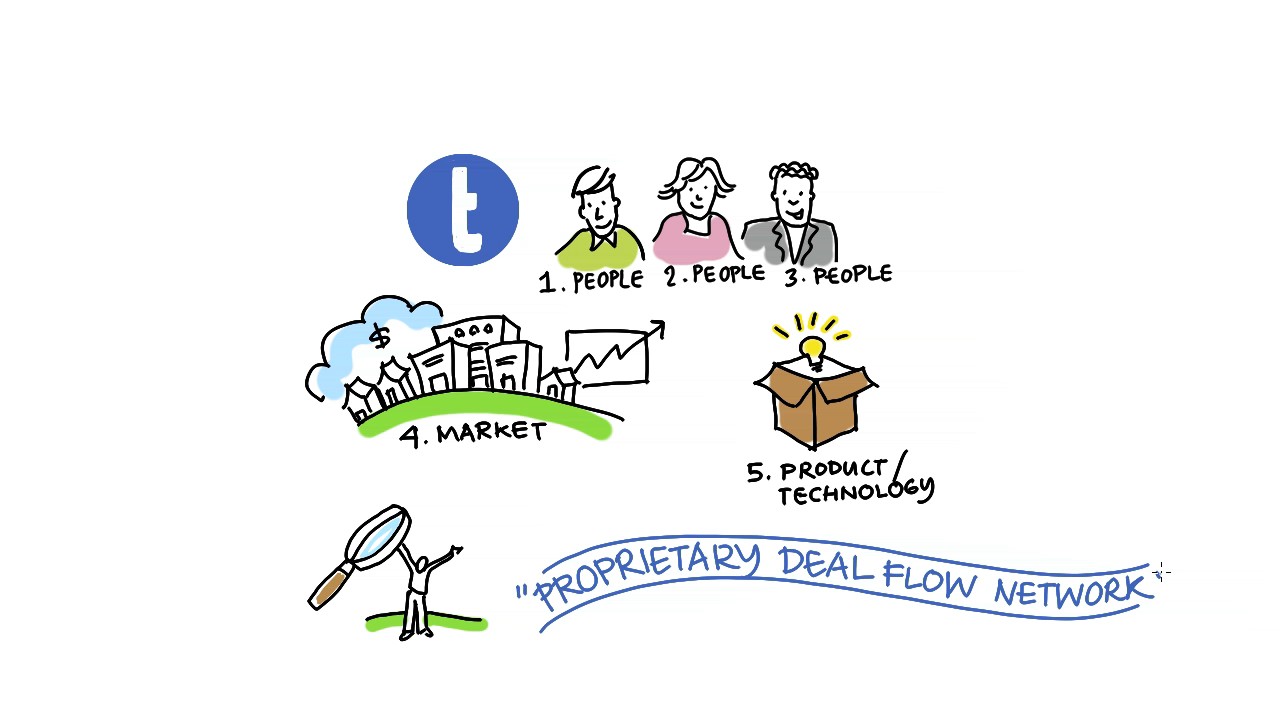
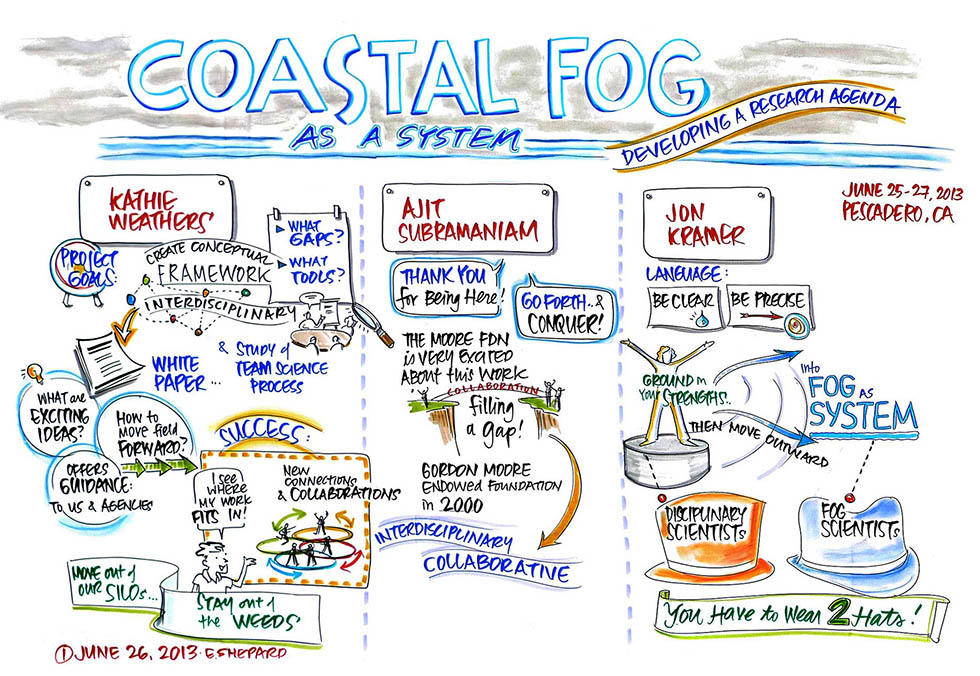
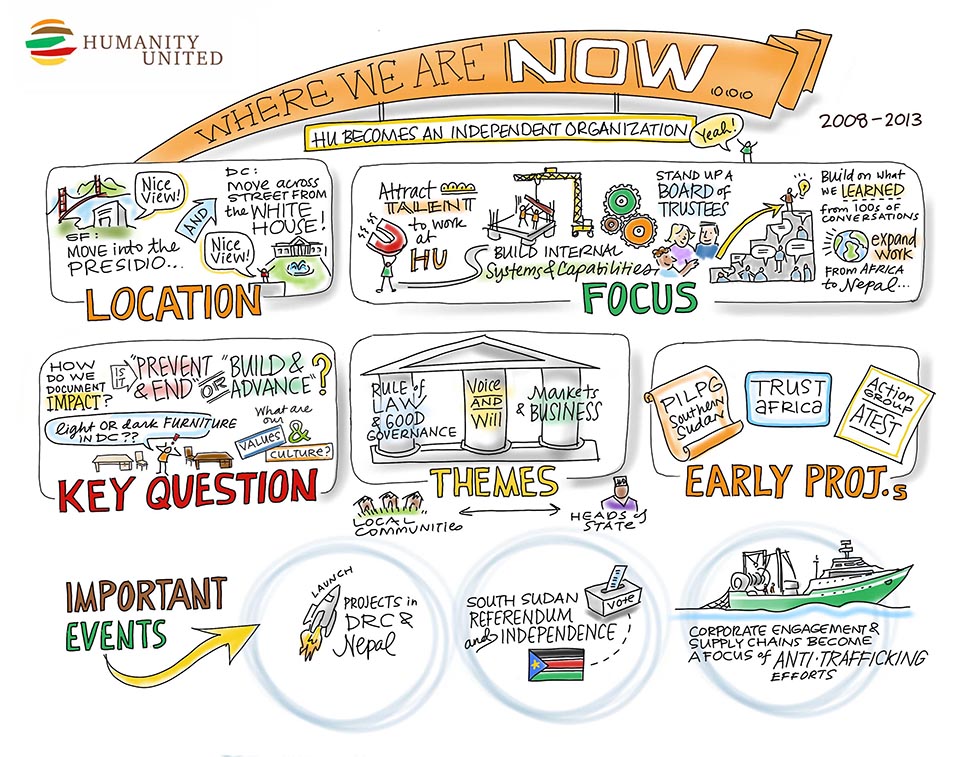
Let’s look at the example of creating an organizational history map. The graphic facilitator might create a framework with vertical divisions for date ranges and four or more horizontal bands (or “swim lanes”) for different types of key milestones, such as: people, products / services, external environment, and other relevant categories.
The participants use large sticky notes to capture content, collapse similar ideas and populate the chart across the timeline. The interactivity happens here as participants discuss and decide what goes where, what the key highlights are within each date range, and what the implications are for the forward momentum of their organization.
The level of engagement, commitment (and fun!) soars when people have the ability to work together in this way. Plus, the task are often completed more quickly, given that small groups can parallel process, and people can self select what areas to work on.
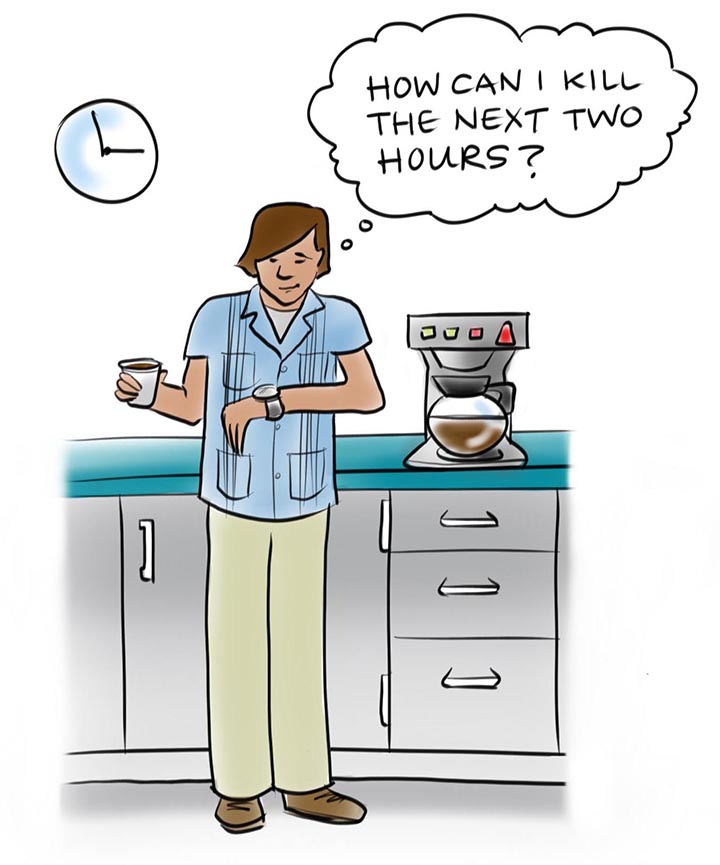
Compare this with the brain-numbing process of a group watching a cursor blink on a screen as someone types milestones into a spreadsheet!
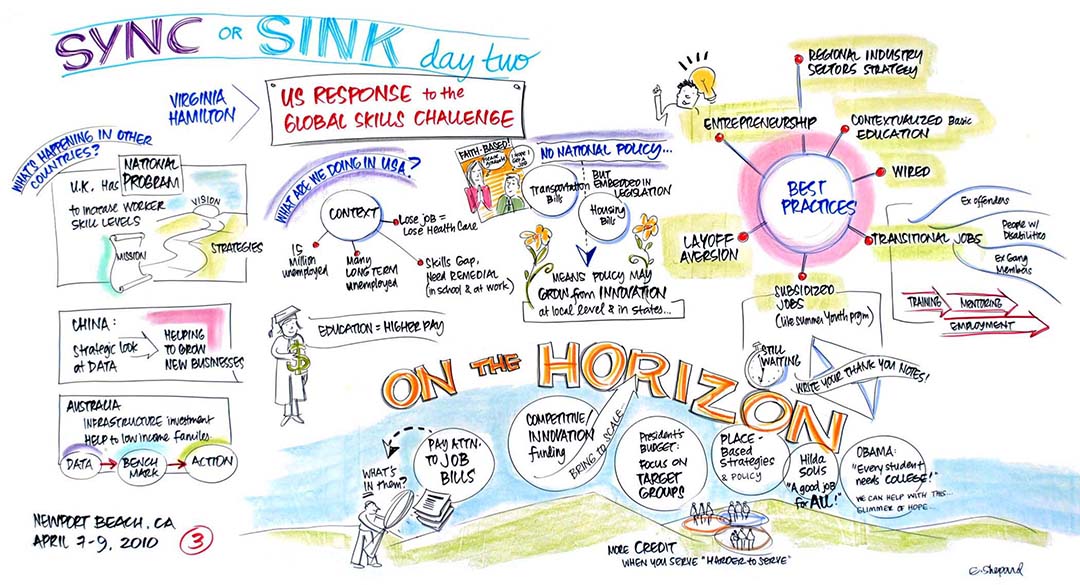
Graphic Facilitation is a visual way to help groups work more effectively together. It can support a broad range of group processes, with different levels of interactivity among the participants.
The three bubbles I’ve described here are not isolated. Oftentimes, an all-day meeting incorporates all three types of graphic facilitation activities: reinforcing learning, building engagement and participation, and co-creating understanding.
How can you envision bringing graphic facilitation into your next group event?